|

The 2013 Most Dangerous States
"1" is Most Dangerous, "50" is Safest
ALPHA ORDER
RANK ORDER
2011
STATE
SUM
2011
Change
2012
STATE
SUM
2012
Change
|
17 |
Alabama |
6.78 |
18 |
-1 |
|
1 |
Nevada |
58.11 |
1 |
0 |
|
7 |
Alaska |
23.05 |
9 |
-2 |
|
2 |
New Mexico |
34.85 |
3 |
-1 |
|
3 |
Arizona |
34.66 |
4 |
-1 |
|
3 |
Arizona |
34.66 |
4 |
-1 |
|
13 |
Arkansas |
10.79 |
15 |
-2 |
|
4 |
Maryland |
34.50 |
5 |
-1 |
|
9 |
California |
17.63 |
10 |
-1 |
|
5 |
Tennessee |
31.79 |
8 |
-3 |
|
22 |
Colorado |
(1.53) |
22 |
0 |
|
6 |
South Carolina |
31.50 |
6 |
0 |
|
40 |
Connecticut |
(37.64) |
39 |
1 |
|
7 |
Alaska |
23.05 |
9 |
-2 |
|
18 |
Delaware |
6.38 |
24 |
-6 |
|
8 |
Florida |
21.06 |
7 |
1 |
|
8 |
Florida |
21.06 |
7 |
1 |
|
9 |
California |
17.63 |
10 |
-1 |
|
20 |
Georgia |
5.30 |
13 |
7 |
|
10 |
Louisiana |
17.55 |
2 |
8 |
|
28 |
Hawaii |
(16.17) |
26 |
2 |
|
11 |
Michigan |
16.55 |
12 |
-1 |
|
39 |
Idaho |
(37.21) |
40 |
-1 |
|
12 |
Texas |
13.85 |
11 |
1 |
|
21 |
Illinois |
2.27 |
19 |
2 |
|
13 |
Arkansas |
10.79 |
15 |
-2 |
|
25 |
Indiana |
(14.44) |
28 |
-3 |
|
14 |
Washington |
9.37 |
16 |
-2 |
|
43 |
Iowa |
(42.78) |
43 |
0 |
|
15 |
Oklahoma |
8.44 |
14 |
1 |
|
27 |
Kansas |
(15.64) |
25 |
2 |
|
16 |
North Carolina |
8.33 |
17 |
-1 |
|
34 |
Kentucky |
(27.00) |
33 |
1 |
|
17 |
Alabama |
6.78 |
18 |
-1 |
|
10 |
Louisiana |
17.55 |
2 |
8 |
|
18 |
Delaware |
6.38 |
24 |
-6 |
|
48 |
Maine |
(61.37) |
49 |
-1 |
|
19 |
Missouri |
5.59 |
20 |
-1 |
|
4 |
Maryland |
34.50 |
5 |
-1 |
|
20 |
Georgia |
5.30 |
13 |
7 |
|
30 |
Massachusetts |
(21.77) |
30 |
0 |
|
21 |
Illinois |
2.27 |
19 |
2 |
|
11 |
Michigan |
16.55 |
12 |
-1 |
|
22 |
Colorado |
(1.53) |
22 |
0 |
|
32 |
Minnesota |
(25.93) |
35 |
-3 |
|
23 |
Ohio |
(1.92) |
23 |
0 |
|
24 |
Mississippi |
(7.95) |
21 |
3 |
|
24 |
Mississippi |
(7.95) |
21 |
3 |
|
19 |
Missouri |
5.59 |
20 |
-1 |
|
25 |
Indiana |
(14.44) |
28 |
-3 |
|
44 |
Montana |
(44.74) |
42 |
2 |
|
26 |
Pennsylvania |
(15.06) |
29 |
-3 |
|
37 |
Nebraska |
(32.39) |
34 |
3 |
|
27 |
Kansas |
(15.64) |
25 |
2 |
|
1 |
Nevada |
58.11 |
1 |
0 |
|
28 |
Hawaii |
(16.17) |
26 |
2 |
|
47 |
New Hampshire |
(60.85) |
47 |
0 |
|
29 |
Oregon |
(18.13) |
27 |
2 |
|
33 |
New Jersey |
(26.94) |
32 |
1 |
|
30 |
Massachusetts |
(21.77) |
30 |
0 |
|
2 |
New Mexico |
34.85 |
3 |
-1 |
|
31 |
New York |
(25.76) |
31 |
0 |
|
31 |
New York |
(25.76) |
31 |
0 |
|
32 |
Minnesota |
(25.93) |
35 |
-3 |
|
16 |
North Carolina |
8.33 |
17 |
-1 |
|
33 |
New Jersey |
(26.94) |
32 |
1 |
|
50 |
North Dakota |
(65.58) |
50 |
0 |
|
34 |
Kentucky |
(27.00) |
33 |
1 |
|
23 |
Ohio |
(1.92) |
23 |
0 |
|
35 |
Rhode Island |
(30.22) |
38 |
-3 |
|
15 |
Oklahoma |
8.44 |
14 |
1 |
|
36 |
Virginia |
(31.85) |
37 |
-1 |
|
29 |
Oregon |
(18.13) |
27 |
2 |
|
37 |
Nebraska |
(32.39) |
34 |
3 |
|
26 |
Pennsylvania |
(15.06) |
29 |
-3 |
|
38 |
Utah |
(32.43) |
36 |
2 |
|
35 |
Rhode Island |
(30.22) |
38 |
-3 |
|
39 |
Idaho |
(37.21) |
40 |
-1 |
|
6 |
South Carolina |
31.50 |
6 |
0 |
|
40 |
Connecticut |
(37.64) |
39 |
1 |
|
45 |
South Dakota |
(48.43) |
45 |
0 |
|
41 |
West Virginia |
(37.87) |
41 |
0 |
|
5 |
Tennessee |
31.79 |
8 |
-3 |
|
42 |
Wisconsin |
(42.11) |
44 |
-2 |
|
12 |
Texas |
13.85 |
11 |
1 |
|
43 |
Iowa |
(42.78) |
43 |
0 |
|
38 |
Utah |
(32.43) |
36 |
2 |
|
44 |
Montana |
(44.74) |
42 |
2 |
|
49 |
Vermont |
(62.33) |
48 |
1 |
|
45 |
South Dakota |
(48.43) |
45 |
0 |
|
36 |
Virginia |
(31.85) |
37 |
-1 |
|
46 |
Wyoming |
(50.03) |
46 |
0 |
|
14 |
Washington |
9.37 |
16 |
-2 |
|
47 |
New Hampshire |
(60.85) |
47 |
0 |
|
41 |
West Virginia |
(37.87) |
41 |
0 |
|
48 |
Maine |
(61.37) |
49 |
-1 |
|
42 |
Wisconsin |
(42.11) |
44 |
-2 |
|
49 |
Vermont |
(62.33) |
48 |
1 |
|
46 |
Wyoming |
(50.03) |
46 |
0 |
|
50 |
North Dakota |
(65.58) |
50 |
0 |
METHODOLOGY:
The Most
Dangerous State 2007 rankings are determined by a four step process.
First, rates for six crime categories — murder, rape, robbery,
aggravated assault, burglary and motor vehicle theft — are plugged into
a formula that measures how a state compares to the national average for
a given crime category.
Second, the outcome of this equation is then
multiplied by a weight assigned to each crime category. For this year’s
award, we again gave each crime category equal weight. Thus state
comparisons are based purely on crime rates and how these rates stack up
to the national average for a given crime category.
Third, the weighted numbers are added together to
achieve state’s score ("SUM.") In the fourth and final step, these
composite scores are ranked from highest to lowest to determine which
states are the most dangerous and safest. Thus the farther below the
national average a state’s crime rate is, the lower (and safer) it
ranks. The farther above the national average, the higher (and more
dangerous) a state ranks in the final list.
A Word About Crime
Rankings
Morgan Quitno’s
Press* annual rankings of crime in states, metro areas and cities are
considered by some in the law enforcement community as controversial.
The FBI and many criminologists caution against rankings according to
crime rates. They correctly point out that crime levels are affected by
many different factors, such as population density, composition of the
population (particularly the concentration of youth), climate, economic
conditions, strength of local law enforcement agencies, citizen’s
attitudes toward crime, cultural factors, education levels, crime
reporting practices of citizens and family cohesiveness. Accordingly,
crime rankings often are deemed “simplistic” or “incomplete.”
However, this criticism is largely based on the fact that there are
reasons for the differences in crime rates, not that the rates are
incompatible. This would be somewhat akin to deciding not to compare
athletes on their speed in the 100-yard dash because of physical or
training differences. Such differences help explain the different speeds
but do not invalidate the comparisons.
To be sure, crime-ranking information must be considered carefully.
However the rankings tell not only an interesting, but also very
important story regarding the incidence of crime in the United States.
Furthermore, annual rankings not only allow for comparisons among
different states and cities, but also enable leaders to track their
communities’ crime trends from one year to the next.
We certainly do not want to be irresponsible in our presentation of
state and city crime data. Our publications help concerned Americans
learn how their communities fare in the fight against crime. The first
step in making our cities and states safer is to understand the true
magnitude of their crime problems. This will only be achieved through
straightforward data that all of us can use and understand.
* Morgan Quitno Press, a Kansas-based publishing
and research company.
States With the
Worst Speeding Ticket Fines
How much were you fined
the last time you were stopped for speeding? Depending on where you
live, the penalty could range from under a hundred bucks to a couple of
thousand dollars or more, even for a first offender. All across America,
local legislators seemingly have one eye on road safety and the other on
cash-strapped coffers. But is it as simple as that? We take a look. And
if you haven't been stopped yet, well, lucky you.
States with highest
speeding-ticket fines
Drivers caught speeding in
the states of Georgia, Illinois, North Carolina, Nevada and New
Hampshire all are liable to be fined up to $1000, at a judge's
discretion, for a first-time speeding offense, according to the National
Highway Traffic Safety Administration. The severity of the financial
penalty also may depend upon the number of miles above the speed limit
when clocked and the number of points on a driver's license, or if the
offense occurred near a school or road works. A driver's license may
also be suspended, their car impounded, or they may face jail time.
Some states including Michigan, Texas and New Jersey, operate under
so-called "driver responsibility" laws, which, in some cases, can result
in a further fine of up to $1000 leveled a year after the conviction.
Virginia, which until 2008 had some of the strictest penalties for
speeders, repealed its driver-responsibility laws last year after a
public outcry. Georgia, meanwhile, has just voted to add $200 to the
fine of what it terms "superspeeders," who travel more than 10 mph over
the speed limit. Other states with fines of up to $500 -- which in many
cases is then compounded with additional court fees -- include Maryland,
Missouri and Oregon.
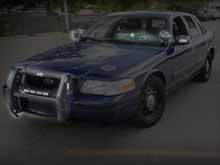
How to Spot Unmarked
Police Cars
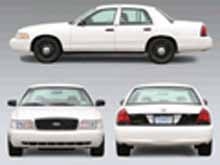 Most
of the time, police cars stand out. They're supposed to do that. You've
likely seen plenty of Ford Crown Victoria cruisers. Also known as the
CVPI (Crown Victoria Police Interceptor), it has been a staple of many
state, county, and local police departments since 1992. Departments
often use the unmarked Crown Victoria for traffic patrols. But what do
officers drive when they don't want to be noticed? The Ford Crown
Victoria has been a police workhorse for nearly two decades. It was
introduced in 1992. Often, police departments will use marked and
unmarked versions of the "Vickies" for traffic patrol work. But how can
you tell whether you're about to speed pass a sedan issued to the Water
and Sewage Department or to the Police Department? Most
of the time, police cars stand out. They're supposed to do that. You've
likely seen plenty of Ford Crown Victoria cruisers. Also known as the
CVPI (Crown Victoria Police Interceptor), it has been a staple of many
state, county, and local police departments since 1992. Departments
often use the unmarked Crown Victoria for traffic patrols. But what do
officers drive when they don't want to be noticed? The Ford Crown
Victoria has been a police workhorse for nearly two decades. It was
introduced in 1992. Often, police departments will use marked and
unmarked versions of the "Vickies" for traffic patrol work. But how can
you tell whether you're about to speed pass a sedan issued to the Water
and Sewage Department or to the Police Department?
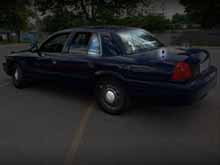
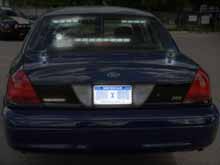
Covert Crown
Victoria: Spotting the clues:
|
Front push bar
Front bumper lights
Remote spotlights
Mirror-mounted flashers
Radar unit and radios on dash
|
Steel wheels with chrome center hubcaps
Bars between front and rear seats to keep the bad guys in their
place
Police antenna on trunk lid
|
Short police radio antenna on trunk
Rear-facing radar
Light flashers in rear window
Government license plate
Police Interceptor badge
|
7 Things Cops Should Never
Say To Anyone
#7. “HEY YOU! COME HERE!”
Consider, you are on
patrol and you see someone suspicious you want to talk with, so you most
naturally say, “Hey you! Come here!” Verbal Judo teaches that “natural
language is disastrous!” and this provides a wonderful example. You have
just warned the subject that he is in trouble. “Come here” means to you,
“Over here, you are under my authority.” But to the subject it means,
“Go away-quickly!” The words are not tactical for they have provided a
warning and possibly precipitated a chase that would not have been
necessary had you, instead, walked casually in his direction and once
close said, “Excuse me. Could I chat with momentarily?” Notice this
question is polite, professional, and calm.
Also notice, you have gotten in close, in his “space” though not his
“face,” and now you are too close for him to back off, giving you a
ration of verbal trouble, as could have easily been the case with the
“Hey you! Come here!” opening.
The ancient samurai knew never to let an opponent pick the place of
battle for then the sun would always be in your eyes! “Come here” is
loose, lazy, and ineffective language. Easy, but wrong. Tactically, “May
I chat with you” is far better, for not only have you picked the place
to talk, but anything the subject says, other than yes or no-the
question you asked-provides you with intelligence regarding his
emotional and/or mental state. Let him start any ‘dance’ of resistance.
Point: Polite civility can be a weapon of immense power!
#6. “CALM DOWN!”
Consider this verbal
blunder. You approach some angry folks and you most naturally say, “Hey,
calm down!” This command never works, so why do we always use it?
Because it flows naturally from our lips!
What’s wrong with it? One, the phrase is a criticism of their behavior
and suggests that they have no legitimate right to be upset! Hence,
rather than reassuring them that things will improve, which should be
your goal, you have created a new problem! Not only is there the matter
they were upset about to begin with, but now they need to defend their
reaction to you! Double the trouble!
Better, put on a calming face and demeanor-in Verbal Judo we say,
‘Chameleon up’-look the person in the eye and say, gently, “It’s going
to be all right. Talk to me. What’s the matter?” The phrase "What’s the
matter?’ softens the person up to talk and calm down; where ‘Calm down’
hardens the resistance. The choice is yours!
#5. “I’M NOT GOING TO TELL
YOU AGAIN!”
We teach in Verbal Judo
that ‘repetition is weakness on the streets!’ and you and I both know
that this phrase is almost always a lie. You will say it again, and
possibly again and again!
Parents do it all the time with their kids, and street cops do it with
resistant subjects, all the time! The phrase is, of course, a threat,
and voicing it leaves you only one viable option-action! If you are not
prepared to act, or cannot at the time, you lose credibility, and with
the loss of creditability comes the loss of power and safety!
Even if you are prepared to act, you have warned the subject that you
are about to do so and forewarned is forearmed! Another tactical
blunder! Like the rattlesnake you have made noise, and noise can get you
hurt or killed. Better to be more like the cobra and strike when least
suspected!
If you want to stress the seriousness of your words, say something like,
‘Listen, it’s important that you get this point, so pay close attention
to what I’m about to tell you.’
If you have used Verbal Judo’s Five Steps of Persuasion you know that we
act after asking our “nicest, most polite question,”
“Sir, is there anything I could say that would get you to do A, B and C?
I’d like to think so?”
If the answer is NO, we act while the subject is still talking! We do
not telegraph our actions nor threaten people, but we do act when verbal
persuasion fails.
#4. “BE MORE REASONABLE!”
Telling people “be more
reasonable” has many of the same problems as “Calm Down!” Everyone
thinks h/she is plenty reasonable given the present circumstances! I
never have had anyone run up to me and say, “Hey, I know I’m stupid and
wrong, but here’s what I think!” although I have been confronted by
stupid and wrong people! You only invite conflict when you tell people
to “be more reasonable!”
Instead, make people more reasonable by the way in which you handle
them, tactically! Use the language of reassurance-“Let me see if I
understand your position,” and then paraphrase-another VJ tactic!-back
to them their meaning, as you see it, in your words! Using your words
will calm them and make them more reasonable because your words will (or
better be!) more professional and less emotional.
This approach absorbs the other’s tension and makes him feel your
support. Now you can help them think more logically and less
destructively, without making the insulting charge implied in your
statement, “Be more reasonable!”
Again, tactics over natural reaction!
#3. “BECAUSE THOSE ARE THE
RULES” (or “THAT’S THE LAW!”)
If ever there was a phrase
that irritates people and makes you look weak, this is it!
If you are enforcing rules/laws that exist for good reason, don’t be
afraid to explain that! Your audience may not agree with or like it, but
at least they have been honored with an explanation. Note, a true sign
of REspect is to tell people why, and telling people why generates
voluntary compliance. Indeed, we know that at least 70% of resistant or
difficult people will do what you want them to do if you will just tell
them why!
When you tell people why, you establish a ground to stand on, and one
for them as well! Your declaration of why defines the limits of the
issue at hand, defines your real authority, but also gives the other
good reason for complying, not just because you said so! Tactically,
telling people why gets your ego out of it and put in its place a solid,
professional reason for action.
Even at home, if all you can do is repeat, “those are the rules,” you
sound and look weak because you apparently cannot support your
order/request with logic or good reason. Indeed, if you can put rules or
policies into context and explain how the rules or policies are good for
everyone, you not only help people understand, you help them save face.
Hence, you are much more likely to generate voluntary compliance, which
is your goal!
#2. “WHAT’S YOUR PROBLEM?”
This snotty, useless
phrase turns the problem back on the person needing assistance. It
signals this is a “you-versus-me” battle rather than an “us” discussion.
The typical reaction is, “It’s not my problem. You’re the problem!”
The problem with the word problem is that it makes people feel deficient
or even helpless. It can even transport people back to grade school
where they felt misunderstood and underrated. Nobody likes to admit
h/she has a problem. That’s a weakness! When asked, “what’s your
problem?” the other already feels a failure. So the immediate natural
reaction is, “I don’t have one, you do!” which is a reaction that now
hides a real need for help.
Substitute tactical phrases designed to soften and open someone up, like
“What’s the matter?”, “How can I help?”, or “I can see you’re upset, let
me suggest . . . .”
Remember, as an officer of peace, it is your business to find ways to
gather good intel and to help those in need, not to pass judgments.
#1. “WHAT DO YOU WANT ME
TO DO ABOUT IT?”
A great cop-out (no pun…)!
This pseudo-question, always accompanied by sarcasm, is clearly an
evasion of responsibility and a clear sign of a lack of creativity! The
phrase really reveals the speaker’s exasperation and lack of knowledge.
Often heard from untrained sales clerks and young officers tasked with
figuring out how to help someone when the rules are not clear.
When you say, “What do you want me to do about it?” you can count on two
problems: the one you started with and the one you just created by
appearing to duck responsibility.
Instead, tactically offer to help sort out the problem and work toward a
solution. If it truly is not in your area of responsibility, point the
subject to the right department or persons that might be able to solve
the problem.
If you are unable or unqualified to assist and you haven’t a clue as to
how to help the person, apologize. Such an apology almost always gains
you an ally, one you may need at same later date. Beat cops need to
remember it is important to “develop a pair of eyes” (contacts) every
time they interact with the public. Had the officer said to the
complainant, for example, “I’m sorry, I really do not know what to
recommend, but I wish I did, I’d like to help you,” and coupled that
statement with a concerned tone of voice and a face of concern, he would
have gone a long way toward making that person more malleable and
compliant for the police later down the road.
Remember, insult strengthens resistance and shuts the eyes. Civility
weakens resistance and opens the eyes!
It’s tactical to be nice!

|